|
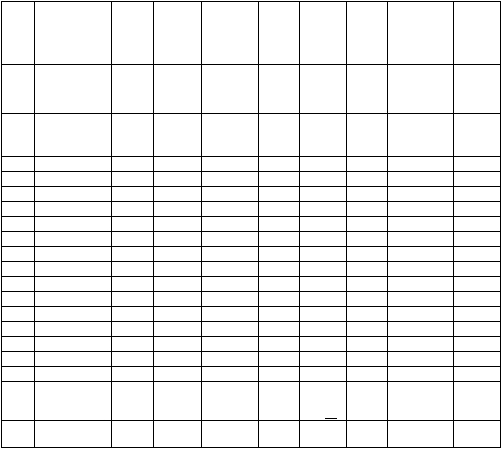
Hereditary Genius
381
I
II
III
IV
Events Per
1000 by
Experience
V
VI
VII.
VIII
IX
X.
Events per
1000 by
Calculatio
n
Classes
Range included in
each Class
No of
Observati
ons in
each Class
Ditto raised
as 1000 to
487
Probabilities
derived from
Experience
Corres-
ponding
Grade in
N
Differences
Revised
Grades
Probabilities
derived from
Calculation
Differences
in previous
Columns
sec—
35
— 3.25—3.75
1
3
500
500
All grades
below -35.0
4
—30
— 2.75—3.25
6
12
498
45.5
10.5
41.5
496
10
—25
— 2.25—2.75
12
25
486
35.0
7.0
35.0
486
22
—20
— 1.75—2.25
21
43
461
28.0
6.0
28.5
464
46
—15
— 1.25—1.75
36
74
418
22.0
5.4
20.0
418
81
—10
— 0.75—1.25
61
126
344
16.6
7.3
15.5
341
126
—05
— 0.25—0.75
73
150
218
9.3
6.7
9.0
215
152
68
2.6
2.5
063
Mean
+ 0.25—0.25
82
168
6.6
163
100
40.0
4.0
100
+ 05
+ 0.25+0.75
72
143
248
10.5
6.5
10.5
247
147
+ 10
+ 1.75+1.25
63
129
377
18.5
8.5
17.0
359
112
+ 15
+ 1.25+1.75
38
78
455
27.0
8.5
25.5
431
72
+20
+ 1.75+2.25
16
33
488
35.5
8.5
30.0
471
40
+25
+ 2.25+2 75
5
10
498
45.5
10.0
36.5
490
19
+30
+ 2.75+3.25
1
20
500
35.0
500
10
+35
+ 3.25+3.75
0
Omitting
extremes
10 66
All grades
above+
1000
487
1000
Average
diff
6.6